Saturday, August 11, 2012

Installation and Configuration in linux with secure my local LAN network websites or personal websites


We can secure our local LAN network websites by using Self signed SSL.

     In this post i am going to explain how to install and configure self signed SSL. Which will secure your personal websites or Internal(LAN) websites


Step 1: Installation of required packages
# yum install mod_ssl openssl
Step 2: Create Private, CSR and Selfsigned key
# mkdir ~/SSL
# cd ~/SSL
# openssl genrsa -out ca.key 1024
# openssl req -new -key ca.key -out ca.csr
# openssl x509 -req -days 365 -in ca.csr -signkey ca.key -out ca.crt


Step 3: Copy the files to correct path
# cp ca.crt /etc/pki/tls/certs
# cp ca.key /etc/pki/tls/private/ca.key
# cp ca.csr /etc/pki/tls/private/ca.csr


Step 4: Edit the SSL Configuration file make the required changes and restart httpd service
# vi /etc/httpd/conf.d/ssl.conf
Edit the line 112 and make sure that SSLCertificate file is pointed to path /etc/pki/tls/certs/ca.crt


Edit the line 119 and make sure that SSLCertificateKeyFile  file is pointed to path /etc/pki/tls/private/ca.key


Restart httpd service to make edited SSL configuration work
# cat > /var/www/html/index.html
Yes SSL Works


Step 5: Verify SSL is working by checking through Browser


Thursday, August 2, 2012

Crontab Log: How to Log the Output of My Cron Script

Question: I created a backup.sh shell script and added it to my crontab to execute it daily. How do I verify whether the backup cron script job ran successfully? Also, I have several echo statements inside my backup.sh shell script. How do I save the output of my script to a log file when it is executed as a cron job?

Answer: Let us say that you’ve added the backup.sh to your crontab as shown below to execute it at midnight every day.
$ crontab -e
59 23 * * * /home/john/bin/backup.sh
To verify whether the this job got executed successfully or not, check the /var/log/cron file, which contains information about all the cron jobs that gets executed in your system. As you see from the following output, john’s cron job got executed succesfully.
$ tail /var/log/cron
Oct  8 22:00:00 dev-db crond[18340]: (root) CMD (/bin/sh /home/root/bin/system_check &)
Oct  8 23:00:00 dev-db crond[20348]: (oracle) CMD (/bin/sh /home/oracle/bin/cleanup.sh &)
Oct  8 23:59:00 dev-db crond[20399]: (john) CMD (/bin/sh /home/john/bin/backup.sh &)
Cron log contains the following information:
  • Timestamp – The date and time when the cron job was executed
  • Hostname – The hostname of the server (For example, dev-db)
  • The cron deamon name and the PID. For example, crond[20399]
  • Username – The username under which this cron job got executed. For example, john.
  • CMD – Anything following this is the real command that got executed at that time.
If there are any echo statements inside the backup.sh, you might want to log those into a file. In general, if the backup.sh cron script throws any output (including errors), you might want to log those to a log file. To do this, modify the crontab entry and add the output and error redirection as shown below.
$ crontab -e
59 23 * * * /home/john/bin/backup.sh > /home/john/logs/backup.log 2>&1
In the above:
  • > /home/john/logs/backup.log indicates that the standard output of the backup.sh script will be redirected to the backup.log file.
  • 2>&1 indicates that the standard error (2>) is redirected to the same file descriptor that is pointed by standard output (&1).
  • So, both standard output and error will be redirected to /home/john/logs/backup.log

Wireshark Display Filter Examples (Filter by Port, IP, Protocol)

While debugging a particular problem, sometimes you may have to analyze the protocol traffic going out and coming into your machine. Wireshark is one of the best tool used for this purpose. In this article we will learn how to use Wireshark network protocol analyzer display filter.


1. Download and Install Wireshark Download wireshark from here.
After downloading the executable, just click on it to install Wireshark.

2. Select an Interface and Start the Capture

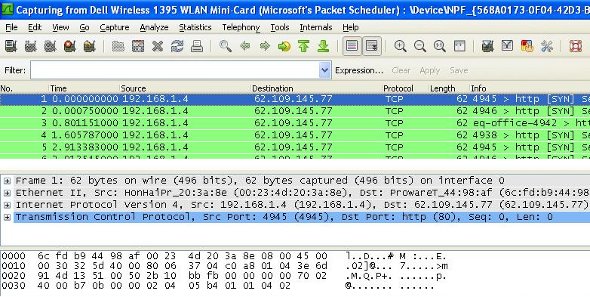
Once you have opened the wireshark, you have to first select a particular network interface of your machine. In most of the cases the machine is connected to only one network interface but in case there are multiple, then select the interface on which you want to monitor the traffic.
From the menu, click on ‘Capture –> Interfaces’, which will display the following screen:


3. Source IP Filter
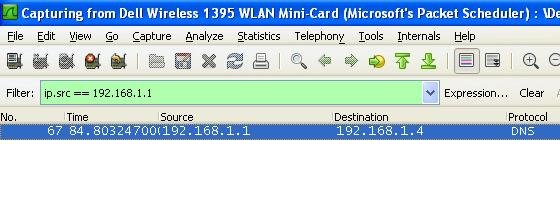
A source filter can be applied to restrict the packet view in wireshark to only those packets that have source IP as mentioned in the filter. The filter applied in the example below is:
ip.src == 192.168.1.1


4. Destination IP Filter
A destination filter can be applied to restrict the packet view in wireshark to only those packets that have destination IP as mentioned in the filter. For example:
ip.dst == 192.168.1.1
5. Filter by Protocol
Its very easy to apply filter for a particular protocol. Just write the name of that protocol in the filter tab and hit enter. In the example below we tried to filter the results for http protocol using this filter:
http
6. Using OR Condition in Filter
This filter helps filtering the packets that match either one or the other condition.
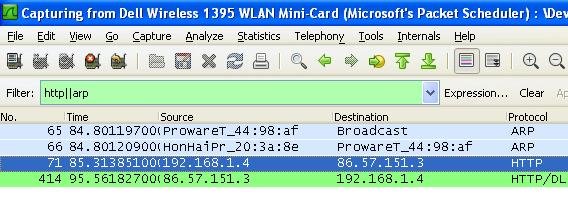
Suppose, there may arise a requirement to see packets that either have protocol ‘http’ or ‘arp’. In that case one cannot apply separate filters. So there exists the ‘||’ filter expression that ORs two conditions to display packets matching any or both the conditions. In the example below, we tried to filter the http or arp packets using this filter:
http||arp


7. Applying AND Condition in Filter
This filter helps filtering packet that match exactly with multiple conditions.
Suppose there is a requirement to filter only those packets that are HTTP packets and have source ip as ’192.168.1.4′. Use this filter:
http&&ip.src==192.168.1.4
8. Filter by Port Number
This can be done by using the filter ‘tcp.port eq [port-no]‘. For example:
tcp.port eq 80
9. Match Packets Containing a Particular Sequence
The filter syntax used in this is : ‘[prot] contains [byte sequence]‘.
For example:
tcp contains 01:01:04
10. Reject Packets Based on Source or Destination
Filter here is ‘ip.src != [src_addr]‘ or ‘ip.dst != [dst_add]‘.
For example:
ip.dst != 192.168.1.1